WordPress admin was taking over 16 seconds to load any authenticated page on a production site. The server had ample headroom, PHP was current, and the MySQL slow query log showed zero long-running queries. The public site was fast because page caching served static HTML directly from Nginx, but backend administrative operations were nearly unusable.
The cause was a single plugin firing uncached, synchronous outbound HTTP calls on every admin request, regardless of whether the screen had anything to do with that plugin.
The symptom
Every WordPress admin route was slow - not just the editor, and not just calendar screens. The dashboard, post lists, and plugin settings pages all exhibited an identical delay: roughly 16 extra seconds added to every request before the first byte of HTML arrived.
The usual infrastructure bottlenecks were ruled out immediately:
- Server CPU and memory utilization were nominal (CPU load under 0.1)
- PHP-FPM worker pool was healthy with plenty of idle processes initially
- No slow queries appeared in MySQL logs
- Edge and page caching operated normally for unauthenticated visitors
The bottleneck was confined entirely to authenticated requests that bypassed cache.
The 0% CPU illusion and worker starvation
A 16-second delay with zero CPU usage is the signature of an I/O wait state. In PHP-FPM, synchronous cURL or stream socket calls suspend the worker process in an uninterruptible network sleep (poll() or select()) while waiting on the remote socket.
Because the process is sleeping, htop shows near-zero CPU load. But the process slot remains occupied. If pm.max_children is configured for 20 workers, just 4 editorial users clicking through the admin or triggering background autosaves will lock up 16 to 20 worker slots simultaneously (4 concurrent users * 16s delay = 64 worker-seconds). The worker pool exhausts in seconds, new requests queue in the socket backlog, and Nginx starts throwing 504 Gateway Timeout errors to other users while system load looks completely normal.
Finding it with Query Monitor
How I isolated the plugin bottlenecking WordPress admin by 16 seconds
Profiling tools add instrumentation overhead, so Query Monitor was enabled on a staging clone with replicated production database state. Its HTTP API calls panel isolated the cause on the first request: 28 out of 31 outbound HTTP calls on a typical admin page came from a single plugin.
Modern Events Calendar (MEC) by Webnus was responsible for:
- 28 out of 31 HTTP calls (over 90%) on every admin page load
- 16 seconds of additional load time (over 95% of total request duration)
- External calls hitting remote vendor endpoints on every admin route, not just MEC-specific screens
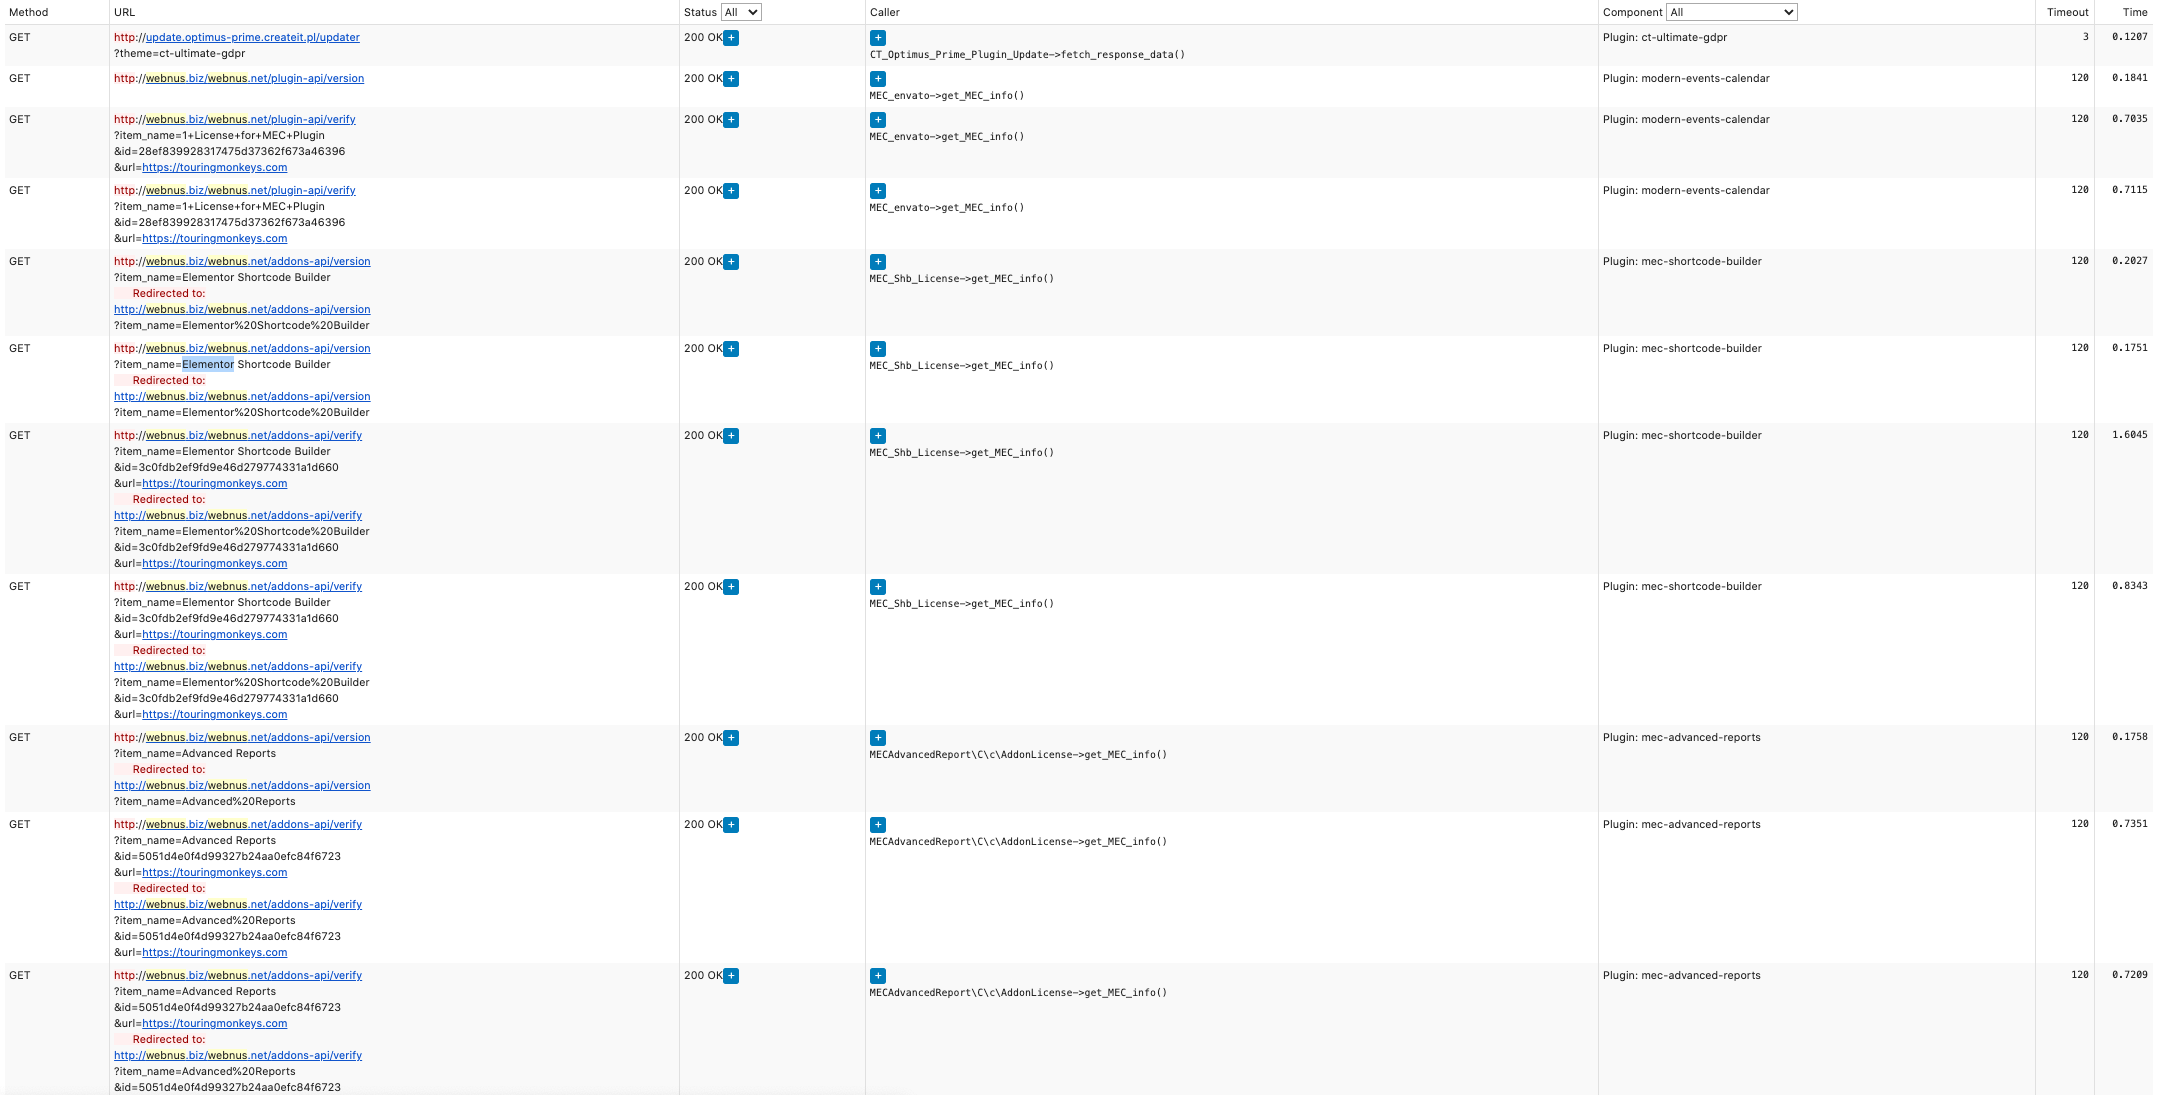
The calls targeted remote license verification and addon API checks. They were not cached locally. They were not batched. They fired unconditionally on every admin page load.
Root cause and the 16-second delay floor
Plugin vendors frequently implement license verification by querying an external licensing server on admin_init. Handled properly, the verification response is cached locally for hours or days. Handled poorly, it fires synchronously on every request, blocking the PHP thread until the remote endpoint responds or times out.
Why was the delay consistently 16 seconds? WordPress core's HTTP API (wp_remote_get) defaults to a 5-second connection timeout ('timeout' => 5). The plugin executed three sequential, unbatched verification requests in a loop. Three calls times the 5-second socket timeout, combined with external DNS resolution (getaddrinfo) and TCP handshake latency across network hops, created an unyielding 16-second floor for every request.
The transient cache failure loop
When plugins attempt to cache license verification using WordPress transients (set_transient), the data is written to the wp_options table unless an external Redis or Memcached object cache is active.
If the vendor's licensing server is degraded, throttling requests, or returning invalid JSON, the verification function treats the response as a failure and does not populate the transient key. Every subsequent page load encounters an immediate cache miss and re-executes the blocking network sequence.
Host-level mitigation
The architectural fix is for the vendor to cache verification responses locally and handle external timeouts gracefully. While reporting the issue upstream and confirming that license validation had already succeeded, outbound traffic to the vendor endpoints was blocked at the host level:
http://webnus.biz/webnus.net/plugin-api/verifyhttp://webnus.biz/webnus.net/addons-api/verify
See Block outgoing URL calls with iptables on Linux for the iptables string-matching approach used to drop these requests without altering plugin source code.
Why host egress instead of application-level blocking?
WordPress provides application-level controls like WP_HTTP_BLOCK_EXTERNAL in wp-config.php, and developers often consider writing an mu-plugin with a pre_http_request filter. Host-level egress blocking was chosen deliberately:
- Whitelisting blast radius:
WP_HTTP_BLOCK_EXTERNALblocks all external HTTP requests unless explicitly listed inWP_ACCESSIBLE_HOSTS. In an estate with payment gateways, transactional email (SES or SendGrid), CDN offloading, and core updates, building and testing an exhaustive whitelist under incident conditions carries high regression risk. - The
WP_Errorcrash trap: Naivepre_http_requestfilters return aWP_Errorobject. Incompetent commercial plugins routinely assume$responseis an array and access$response['body']directly without checkingis_wp_error(). Returning aWP_Errorturns a 16-second delay into a fatal PHP exception (Uncaught Error: Cannot use object of type WP_Error as array). - Surviving plugin updates: Editing plugin code directly is temporary; the first automated update overwrites the patch. Dropping the traffic at layer 4 or layer 7 via host iptables string-matching is zero-touch, survives plugin updates, and leaves application files untouched.
Result
Admin load times dropped from 16+ seconds to under 1 second immediately upon dropping outbound traffic to the verification endpoints. The plugin continued to operate normally without losing functionality because the initial license check had already passed.
Diagnostic takeaway
When WordPress admin performance degrades and server resources look clean, inspect outbound HTTP calls first. Isolating a plugin bottlenecking WordPress admin by 16 seconds came down to checking network wait states with Query Monitor rather than debugging database queries or blaming host capacity. Hosting support typically investigates server load, memory, and response time at the infrastructure level. A delay that originates inside the PHP application runtime (outbound HTTP calls, slow queries, object cache misses) does not appear in those metrics. The investigation has to start from the application layer, with Query Monitor or equivalent, not from a support ticket asking the host to check CPU.
For a full technical breakdown of all common causes of slow WordPress admin (including autoloaded options, Heartbeat API, and object caching), see Why Is My WordPress Admin Slow? A Technical Diagnosis Guide.